1 Overview of Accounting Analytics
The world’s most valuable resource is no longer oil, but data (The Economist 2017).
AI is … also reshaping the skillset required in the accounting profession. Today’s accountants need to be tech-savvy, with a keen understanding of how AI tools work and how they can be applied in various accounting scenarios (Forbes 2024).
Learning Objectives of the Chapter
At the End of the Chapter, Students should be Able to -
Gain an understanding about the uses and importance of data analytics in organizations
Gain an understanding about the uses and importance of data analytics in Accounting
Identify different characteristics of big data
Know how data analytics are impacting different disciplines of accounting
Know the types of Data Analytics
Know the Data Analytics Process
1.1 Data Analytics & Big Data
Given the availability of vast amount of data, companies in numerous industries exploit such data for competitive advantage, aiming to either increase revenues or decrease costs. Data Driven Decisions (DDD) are making significant differences in productivity, on Return on Assets (ROA), Return on Equity (ROE), asset utilization, and on market value (Provost and Fawcett 2013). Firms using data analytics in their operations can outperform their competitors by 5% in productivity and 6% in profitability (Barton and Court 2012). In 2017, 53% companies have adopted big data, as compared to only 17% in 2015 (Columbus 2017). Additionally, regulators are increasingly calling for organizations to use analytics (Protiviti 2017). This evolving landascape in industry emphasizes the significance of data analytics in organizations.
Analytics is a means of extracting value from data. Analytics is the assessment of data with technology tools. Today, there are more powerful analytics tools to more efficiently and effectively analyze a broader range of data and types of data than in the past. Thus, there is an increased opportunity for enhanced insights about what stories data can tell to address business issues and transform the way decisions are made.
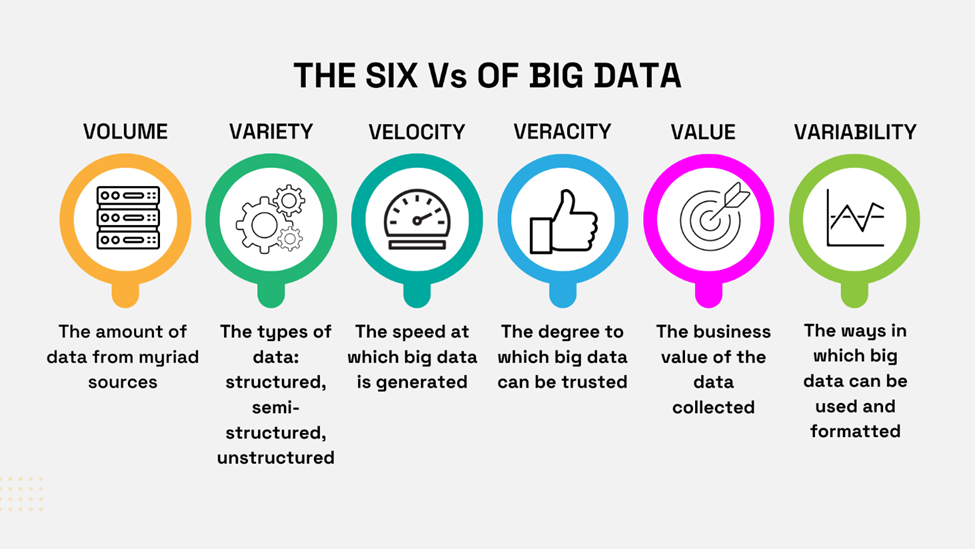
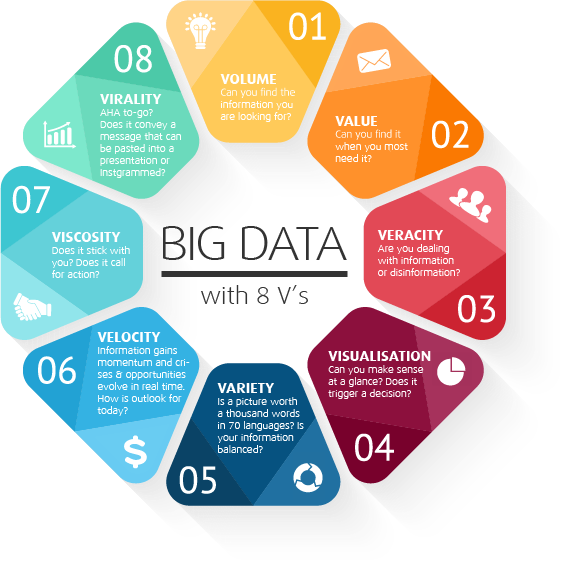
The meaning of (big) data analytics varies across different disciplines and there is substantive confusion between the slightly differing characterizations of “big data,” “business intelligence,” and “data analytics” (Vasarhelyi, Kogan, and Tuttle 2015). Though many people consider big data in terms of quantities, it is also related to large-scale analysis of large amounts of data to generate insights and knowledge (Verver 2015). Big data is characterized by four Vs: Volume; Velocity; Variety; and Veracity. Volume refers to the size of the dataset, velocity to the speed of data generation, variety to the multiplicity of data sources, and veracity to the elimination of noise and obtaining truthful information from big data. Sometimes big data are characterized by six Vs: Volume, Velocity, Variety, Veracity, Variability, and Value; or, even seven Vs: Volume, Velocity, Variety, Veracity, Variability, Value, and Visualization (Sivarajah et al. 2017). Some people also identify sometimes eight Vs for big data. Figure 1.1 and Figure 1.2 depict the six and eight Vs of big data respectively.
Data analytics is defined as “the art and science of discovering and analyzing patterns, identifying anomalies, and extracting other useful information in data underlying or related to the subject matter of an audit through analysis, modeling, and visualization for the purpose of planning or performing the audit” (American Institute of Certified Public Accountants (AICPA) 2015, 105). Cao, Chychyla, and Stewart (2015) define big data analytics as the process of inspecting, cleaning, transforming, and modeling big data to discover and communicate useful information and patterns, suggest conclusions, and to provide support for decision-making.
Data analytics promises significant potential in auditing. Therefore, in accounting, sometimes data analytics becomes synonymous with audit analytics. Audit analytics involves the application of data analytics in the audit. Specifically, American Institute of Certified Public Accountants (AICPA) (2017) defines audit data analytics as “the science and art of discovering and analyzing patterns, identifying anomalies and extracting other useful information in data underlying or related to the subject matter of an audit through analysis, modeling and visualization for the purpose of planning or performing the audit.” In other words, audit data analytics are techniques that can be used to perform a number of audit procedures such as risk assessment, tests of details, and substantive analytical procedure to gather audit evidence. The benefits of using audit data analytics include improved understanding of an entity’s operations and associated risk including the risk of fraud, increased potential for detecting material misstatements, and improved communications with those charged with governance of audited entities.
1.1.1 Big Data Spectrum
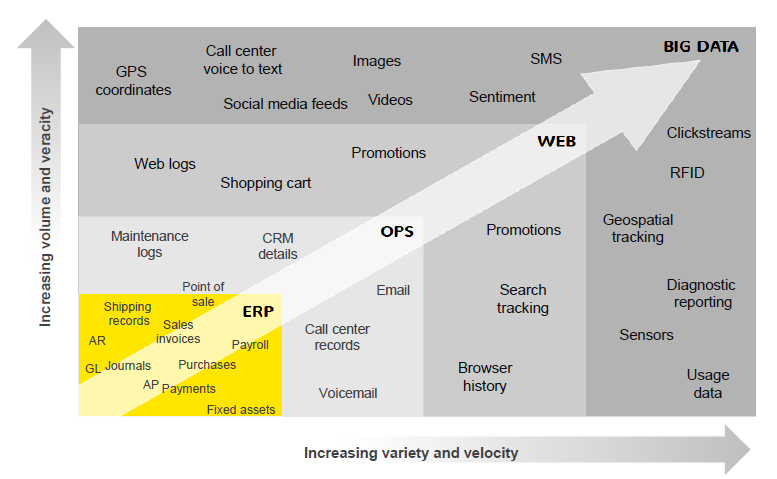
The data dynamics and the way businesses are using data are relatively new to the world of business and something that accounting and business students must become more familiar with. Figure 1.3 depicts the big data spectrum. You’ll notice that the data in yellow at the left bottom portion of the spectrum has less of the four V’s. This typically is data that is sourced from enterprise resource planning (ERP) systems. This is also the type of data that a business analyst, especially an accountant, most often works with.
Continuing along the trajectory, you’ll see data generated from operating systems, such as call center records, email, voicemail, etc. From there, you’ll see data that comes from the web, including shopping cart information, web logs, browser history, promotion information, etc. This then moves beyond to the “biggest” category of data, which includes videos, radio-frequency identification (RFID), global positioning system (GPS) coordinates, social media feeds and more.
1.2 Importance of Data Analytics in Accounting
Data analytics is important for accounting profession because data gathering and analytics technologies have the potential to fundamentally change accounting and auditing task processes (Schneider et al. 2015). Scholars note that the emergence of data analytics will significantly change the infer/predict/assure (e.g., insight/foresight/oversight) tasks performed by accountants and auditors. Big data and analytics have increasingly important implications for accounting and will provide the means to improve managerial accounting, financial accounting, and financial reporting practices (Warren, Moffitt, and Byrnes 2015). It is further suggested that big data offers an unprecedented potential for diverse, voluminous datasets and sophisticated analyses. Research indicates that big data has great potential to produce better forecast estimates, going concern calculations, fraud, and other variables that are of concern to both internal and external auditors (Alles 2015). Moreover, auditors might reduce audit costs and enhance profitability and effectiveness by means of big data or data analytics. Sixty-six percent of internal audit departments currently utilize some form of data analytics as part of the audit process (Protiviti 2017).
1.2.1 Data Analytics in Financial Accounting
Warren, Moffitt, and Byrnes (2015) note that “in financial accounting, big data will improve the quality and relevance of accounting information, thereby enhancing transparency and stakeholder decision-making. In reporting, big data can assist with the creation and refinement of accounting standards, helping to ensure that the accounting profession will continue to provide useful information as the dynamic, real-time, global economy evolves.” In particular, they suggest that big data could significantly impact the future of financial accounting and Generally Accepted Accounting Principles (GAAP). Big data can also help to supplement financial statement disclosures by accumulating, processing, and analyzing information about a given intangible of interest. Furthermore, big data or data analytics can help in narrowing the differences between accounting standards such US GAAP and International Financial Reporting Standards (IFRS) and facilitate different measurement processes such as Fair Value Accounting (FVA) by analyzing different kinds of unstructured data (Warren, Moffitt, and Byrnes 2015).
Crawley and Wahlen (2014) noted that data analytics allows researchers to explore a large amount of qualitative information disclosed by organizations, and examines the consequences of such disclosures. Moreover, data analytics now provides the opportunity to judge the informational content of qualitative financial information. For example, Davis, Piger, and Sedor (2012) found that the extent of optimism expressed in firms’ earnings announcements is positively associated with Return on Assets (ROA) and stock reactions. By the same token, Li (2010) suggested that the tone of forward-looking statements is positively associated with future earnings performance. In addition, Feldman et al. (2010) found that changes in disclosure tone is indicative of future changes in earnings. Interestingly, research shows that even information on social media such as Twitter can predict stock market responses (Bollen, Mao, and Zeng 2011).
Data analytics helps to relate textual data to earnings quality. For example, firms having more complicated and less transparent financial statement disclosures are more likely to have poor quality earnings, less persistent positive earnings and more persistent negative earnings (Li 2008). Li, Lundholm, and Minnis (2013) confirmed that firms discussing their competition frequently have ROAs that mean returns more severely than the firms discussing the competition infrequently.
With the help of textual data analytics, researchers recently documented the role that qualitative disclosures have in forming the information environment of organizations; such information environments include factors such as the number of analyst following a firm, characteristics of its investors, its trading activities, and the litigation it is involved with. Less readable 10-Ks are associated with greater number of analysts following the firm and a greater amount of effort needed to generate report about it (Lehavy, Li, and Merkley 2011). They also find that less readable 10-Ks are associated with greater dispersion, lower accuracy, and greater uncertainty in analyst’s earnings forecasts about a given firm.
Data analytics in Financial Accounnting - A. has potential to enhance quality and relevance of accounting information, B. can supplemental financial statement disclosures, C. can facilitate different measurement processes, and D. allows to explore a large amount of qualitative information
1.2.2 Data Analytics in Management Accounting
Warren et al. (2015, 397) noted that “in managerial accounting, big data will contribute to the development and evolution of effective management control systems and budgeting processes. In particular, they elaborate on how big data or data analytics can play a role in management control systems by discovering behaviors that have correlation with specific goal outcomes. Essentially, big data analytics can locate new kinds of behaviors that might impact goal outcomes by simplifying the identification of important motivational measurement tools linked to organizational goals. Moreover, by analyzing non-structured data, big data analytics can help discern employee morale, productivity, and customer satisfaction. Data analytics can also be used to improve “beyond budgeting practices” since traditional budgeting sometimes creates barriers to creativity and flexibility (Warren, Moffitt, and Byrnes 2015).
Richins et al. (2017) suggest that big data analytics could improve customer service quality. They suggest that most of the time organizations use structured data that are in their records to evaluate customer service quality; however, this approach does not take into account the customer perspective. Big data analytics allow organizations to evaluate this customer perspective by using unstructured data from social media or e-commerce sites, thus permitting organizations to have a holistic view of customer service quality.
Managers recognize that financial measures, alone, are insufficient to forecast future financial success or to use for performance management. Big data analytics provides opportunities to incorporate non-financial measures by incorporating unstructured data (Richins et al. 2017). Using big data analytics (particularly the analysis of unstructured data) accountants can identify the causes of underlying problems, understand ramifications, and develop plans to mitigate adverse impacts (Richins et al. 2017). Data analytics can also provide accountants with additional tools to monitor operations and product quality, discover opportunities to reduce costs, and contribute to decision-making (Dai and Vasarhelyi 2016).
Data analytics in Management Accounnting - A. will contribute to the development of effective management control systems and budgeting processes, B. can enhance employee morale, productivity, and customer satisfaction, C. can enhance customer service quality by evaluating customer perspectives using unstructured data from social media or e-commerce, D. creates opportunities to incorporate non-financial measures by incorporating unstructured data, and E. provide accountants with additional tools to monitor operations and product quality, and discover opportunities to reduce costs.
1.2.3 Data Analytics in Auditing
Data analytics has the potential to improve the effectiveness of auditing by providing new forms of audit evidence. Data analytics can be used in both auditing planning and in audit procedures, helping auditors to identify and assess risk by analyzing large volumes of data. Even organizations that have very immature capabilities indicate that a strong level of value is derived from including analytics in the audit process (Protiviti 2017).
Big data is being seen by practitioners as an essential part of assurance services (Alles and Gray 2016), but its application in auditing is not as straightforward as it is in marketing and medical research. Appelbaum (2016) and Cao, Chychyla, and Stewart (2015) identified several areas that are likely to benefit from the use of big data analytics. Some of the areas are:
At the engagement phase – supplementing auditors’ industry and client knowledge
At the planning phase – supplementing auditors’ risk assessment process
At the substantive test phase – verifying the management assertions
At the review phase – advanced data analytical tools as analytical procedures
At the continuous auditing phase – enhancing knowledge about the clients
Yoon, Hoogduin, and Zhang (2015) suggest that big data create great opportunities through providing audit evidence. They focused on the “sufficiency” and “appropriate” criteria and noted that though there are some issues about the propriety of big data due to different kinds of “noise,” big data can be used as complementary audit evidence. Additionally, they discussed how big data can be integrated with traditional audit evidence in order to add value in the process. Big data or data analytics can also help auditors to test the existence of assertions (e.g. fixed assets) using non-conventional data such as video recording (Warren, Moffitt, and Byrnes 2015). In the world of big data, potential types and sources of audit evidence have changed (Appelbaum 2016). For this reason, Krahel and Titera (2015) suggest that big data might change the focus of auditors, shifting emphasis from management to the verification of data.
Data quality and reliability or verifiability have become important issues in auditors’ evaluations of audit evidence. In this way, big data can be used as part of analytical procedures, which are required at the planning and review phase, but which are optional at the substantive procedure phase. However, many issues remain unresolved about how to use big data since analytical procedures and auditing standards are not very specific about the selection of analytical audit procedures; the choice depends on the professional judgment of auditors (Appelbaum, Kogan, and Vasarhelyi 2017). For this reason, auditors need to exercise increased professional skepticism in the big data era because in many cases sources of big data lack provenance and, subsequently, veracity, and sometimes auditors (particularly internal auditors) have little or no involvement in data quality evaluation of such sources (Appelbaum 2016). Considering the prediction that analytics will spell the demise of auditing, Richins et al. (2017) suggest that auditors in the big data era are still essential because they know “the language of business.” Particularly, they suggest that big data analytics cannot replace the professional judgment used by auditors, suggesting that analytics will instead complement auditors’ professional judgment.
Alles and Gray (2016) identify four potential advantages of incorporating big data into audit practices: strong predictive power to set expectations for financial statement audits, great opportunities to identify potential fraudulent activities, increased probabilities of discovering red flags, and the possibility of developing more predictive models for going concern assumptions. To that end, internal audit groups with dedicated analytics functions and organizations that have attained a managed or optimized to the state of analytics maturity are far more likely to conduct continuous auditing (Protiviti 2017). Though big data creates many opportunities for improving auditing, it also suffers from different shortcomings that hinder its application in Continuous Auditing (CA). For example, Zhang, Yang, and Appelbaum (2015) suggest big data characteristics such as volume, velocity, variety, and veracity creates problems in its application in CA through different gaps such as data consistency, data integrity, data identification, data aggregation, and data confidentiality.
Rose et al. (2017) found that the timing of the introduction of data analytics tools into the audit process affects the evaluation of evidence and professional judgment. Barr-Pulliam, Brown-Liburd, and Carlson (2023) found that jurors consider auditors more negligent when they use traditional auditing technique rather than audit data analytics techniques. Additionally, they confirmed that audit data analytics tools increase the perceptions of audit quality. Schneider et al. (2015) suggest that data analytics can be used by auditors to evaluate the internal control effectiveness and policy compliance. They further suggest that by analyzing unusual data flows, unexpected large volumes of data, high frequency transactions, or duplicate vendor payments, auditors can better detect fraud.
1.2.4 Data Analytics in Tax Accounting
Traditionally, tax analytics has focused on hindsight, particularly dealing with data from transactions that have already occurred. However, recently tax organizations are looking to use data more for gaining insight and sometimes for foresight. Analytics can help to move tax toward insight and foresight, thus changing the mindset from “what do I need to do?” to “what do I need to know?” (Deloitte 2016).
Data analytics can help an organization and its tax function drive toward becoming an insight-driven organization, or IDO (Deloitte 2016). Various types of analytics can be applied to tax issues. Organizations have used tax analytics mostly in creating descriptive scorecards and visualizations (hindsight). These kinds of tax analytics help to determine where to allocate resources, focus on anomalies in results, and identify potential areas of risk.
1.3 Types of Data Analytics
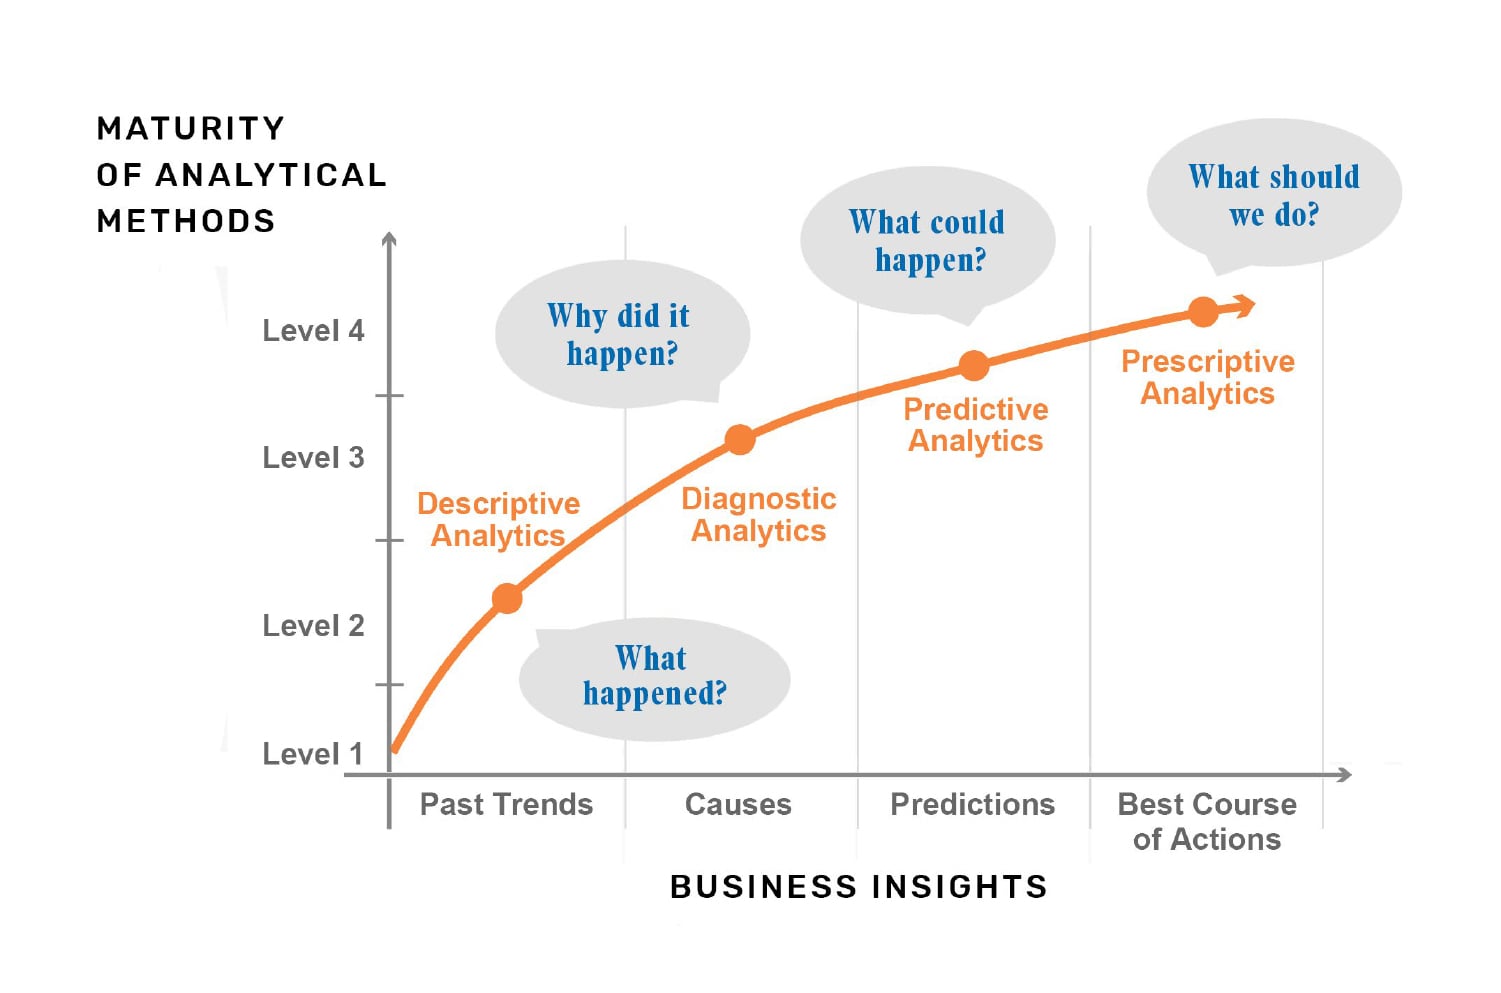
Data analytics can be classified in many ways, but usually there are four types of data analytics. Figure 1.4 depicts the types -
Descriptive Analytics (Business Intelligence & Data Mining)
Diagnostic Analytics
Predictive Analytics (Forecasting)
Prescriptive Analytics (Optimization & Simulation)
1.3.1 Descriptive Analytics
Descriptive analytics looks at data and analyze past event for insight as to how to approach future events. It looks at past performance and understands the performance by mining historical data to understand the cause of success or failure in the past. Almost all management reporting such as sales, marketing, operations, and finance uses this type of analysis. Common types of descriptive analytis are -
Data Queries
Reports
Descriptive Statistics
Data Dashboard
1.3.2 Diagnostic Analytics
In this analysis, we generally use historical data over other data to answer any question or for the solution of any problem. We try to find any dependency and pattern in the historical data of the particular problem. For example, companies go for this analysis because it gives a great insight into a problem, and they also keep detailed information about their disposal otherwise data collection may turn out individual for every problem and it will be very time-consuming. Common techniques used for Diagnostic Analytics are:
Data Discovery
Data Mining
Correlations
1.3.3 Predictive Analytics
Predictive analytics turn the data into valuable, actionable information. predictive analytics uses data to determine the probable outcome of an event or a likelihood of a situation occurring. Predictive analytics holds a variety of statistical techniques from modeling, machine learning, data mining, and game theory that analyze current and historical facts to make predictions about a future event. Techniques that are used for predictive analytics are:
Linear Regression
Time Series Analysis and Forecasting
Data Mining
1.3.4 Prescriptive Analytics
Prescriptive Analytics automatically synthesize big data, mathematical science, business rule, and machine learning to make a prediction and then suggests a decision option to take advantage of the prediction. Prescriptive analytics goes beyond predicting future outcomes by also suggesting action benefits from the predictions and showing the decision maker the implication of each decision option. Prescriptive Analytics not only anticipates what will happen and when to happen but also why it will happen. Further, Prescriptive Analytics can suggest decision options on how to take advantage of a future opportunity or mitigate a future risk and illustrate the implication of each decision option.
1.4 Data Analytics Processes
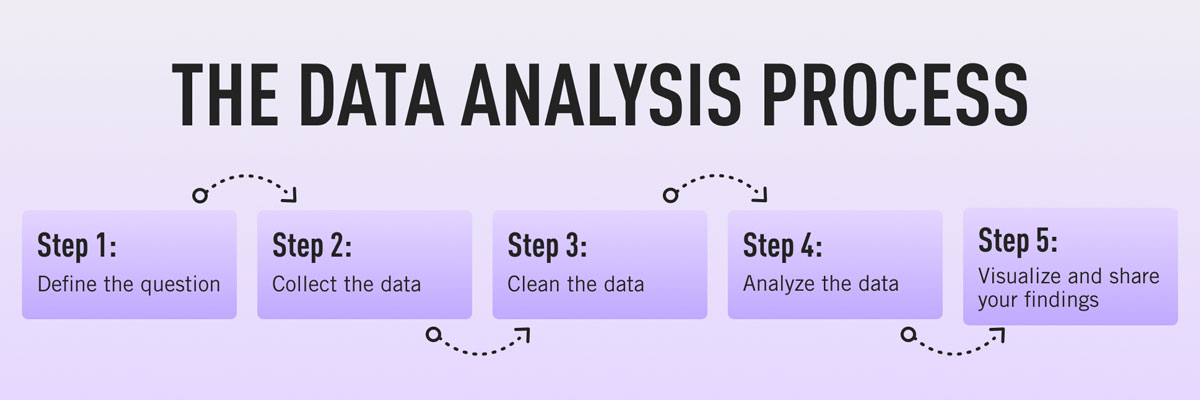
As in in any scientific discipline, data analytics involves a rigorous step-by-step process. Each step demands different skills and know-how. However, to realize the full potential of data analytics, understanding the whole process is important. Figure 1.5 delineates the whole process.
1.4.1 Defining the Questions
The first step in any data analysis process is to define your objective. In data analytics jargon, this is sometimes called the ‘problem statement’. Defining your objective means coming up with a hypothesis and figuring how to test it. For instance, your organization’s senior management might pose an issue, such as: “Why are we losing customers?” It’s possible, though, that this doesn’t get to the core of the problem. A data analyst’s job is to understand the business and its goals in enough depth that they can frame the problem the right way.
1.4.2 Collecting the Data
1.4.3 Cleaning the Data
1.4.4 Analyzing the Data
1.5 Analytics Mindset
Having an analytics mindset is important while performing data analytics processes. An analytics mindset is the ability to:
Ask the right questions
Extract, transform and load relevant data (i.e., the ETL process)
Apply appropriate data analytics techniques
Interpret and share the results with stakeholders
1.5.1 Ask the Right Questions
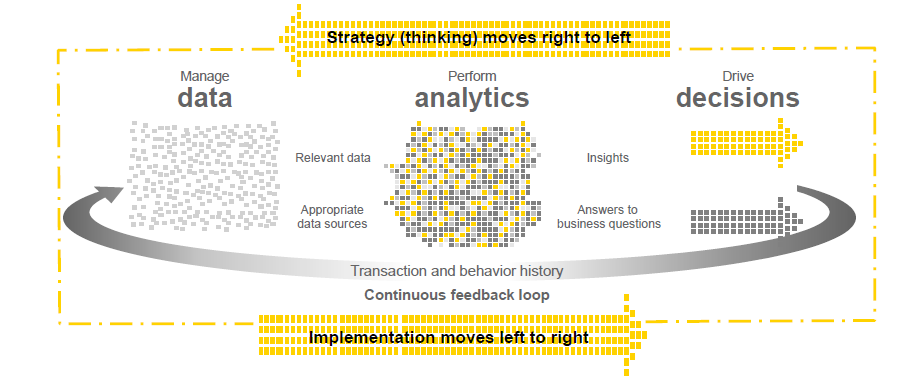
To drive better decisions, one must ask the right questions first and then seek answers in the data. Then one looks to find relevant data and the appropriate data sources to perform the analytics. These analytics will provide the insights and answer the business questions being asked, which then drive the decisions. Throughtout the process, there is a continuous feedback loop that makes the process iterative. An analytics mindset keeps asking questions until the right answers emerge. The right questions are those that lead to the right answers. Figure 1.6 depicts how analytics mindset works.
Being able to ask the right question is not easy; rather it heavily relies on several factors. First, the analyst needs to understand who the relevant stakeholders are and their objectives. Knowing your audience and what they want to accomplish is critical to understanding value and how to identify a right question. Second, the analyst needs to have an understanding of the business and the underlying business processes — the overall business context. As an example, if you were asked to perform a competitive analysis across the high-tech industry and if you didn’t have a strong understanding of the industry and key performance indicators, you might not ask the right questions (e.g., select the right indicators to analyze).
1.5.2 Extract, Transform, and Load Relevant Data (The ETL Process)
The first focus with this competency is understanding data characteristics and their relevance. In terms of data characteristics, we already discussed the four/six V’s and the big data spectrum. In determining relevance, this is a focus on what data aligns with the analysis you need to perform to answer your question.It is also important to understand the flow of data in an accounting information system to understand where your data is coming from and how it is generated. This understanding includes - type of accounting information systems, what modules are in the context, capabilities and the limitations of the data and so on. Once this understanding is established, the ETL process can begin. This starts with the extraction of data. For extraction, key things need to be known, including: what data to ask for, how to ask for data, how to manage data security, what format the data needs to be in.
The next step is transformation, which also is referred to as data cleansing. This involves converting data from one format to another to load it into an analytics tool. This includes making certain that only the data needed is extracted and that this data is complete and accurate. Data cleansing needs to be performed both before and after the data loading process. Loading data includes knowing which tool the data should be loaded into for the most efficient and effective analysis. For example, this might be driven by the amount of data and the capacity of a given analytics tool. Throughout the ETL process, it is important to maintain the integrity of your data. This is often done through data validation, for example, a control total of your data matching an account balance total in the general ledger.
1.5.3 Apply Appropriate Data Analytics Techniques
In determining how to apply appropriate data analytics techniques, it is important to understand: the purpose of different types of data analytics techniques, how to determine which techniques are most appropriate for the objectives of your analysis. objectives might include a need to prove or disprove your expectation if one was developed. For example, during the planning phase of an audit, the auditor is required to assess risk. One way of doing this is by exploring the data and looking for anomalies. As the audit progresses into the execution phase, the auditor considers the risk of error or intentional misstatement, the effectiveness of controls and the amounts actually recorded. The objective is to confirm or disconfirm an expectation regarding recorded amounts.
There are many ways to analyze data. Some of the more fundamental analyses that you should be able to understand and apply include:
– Ratios (e.g., gross margin or a day’s sales in accounts receivable)
– Sorting (e.g., by industry or month)
– Aggregation (e.g., total of an account balance)
– Trends (e.g., the movement in inventory associated with both purchases and sales)
– Comparisons (e.g., sales month to month)
– Forecasting (e.g., budgeted expenses)
It is also important to gain familiarity with analytics tools. There are many tools capable of performing analytics and it isn’t necessary for you to know how to use each one, but you should have some hands-on experience with a few of the more fundamental tools that are most readily used by an analyst. Some of the fundamental tools include: Excel, Basic databases (Access), Visualization (Tableau, Power BI). It is also good to have a working knowledge or awareness of other tools, including those that might be specific to the career path you are choosing. Note that beyond these fundamental tools, there are other tools students should be familiar with, to a lesser extent (a working knowledge or awareness level).
1.6 Data Analytics Skillset
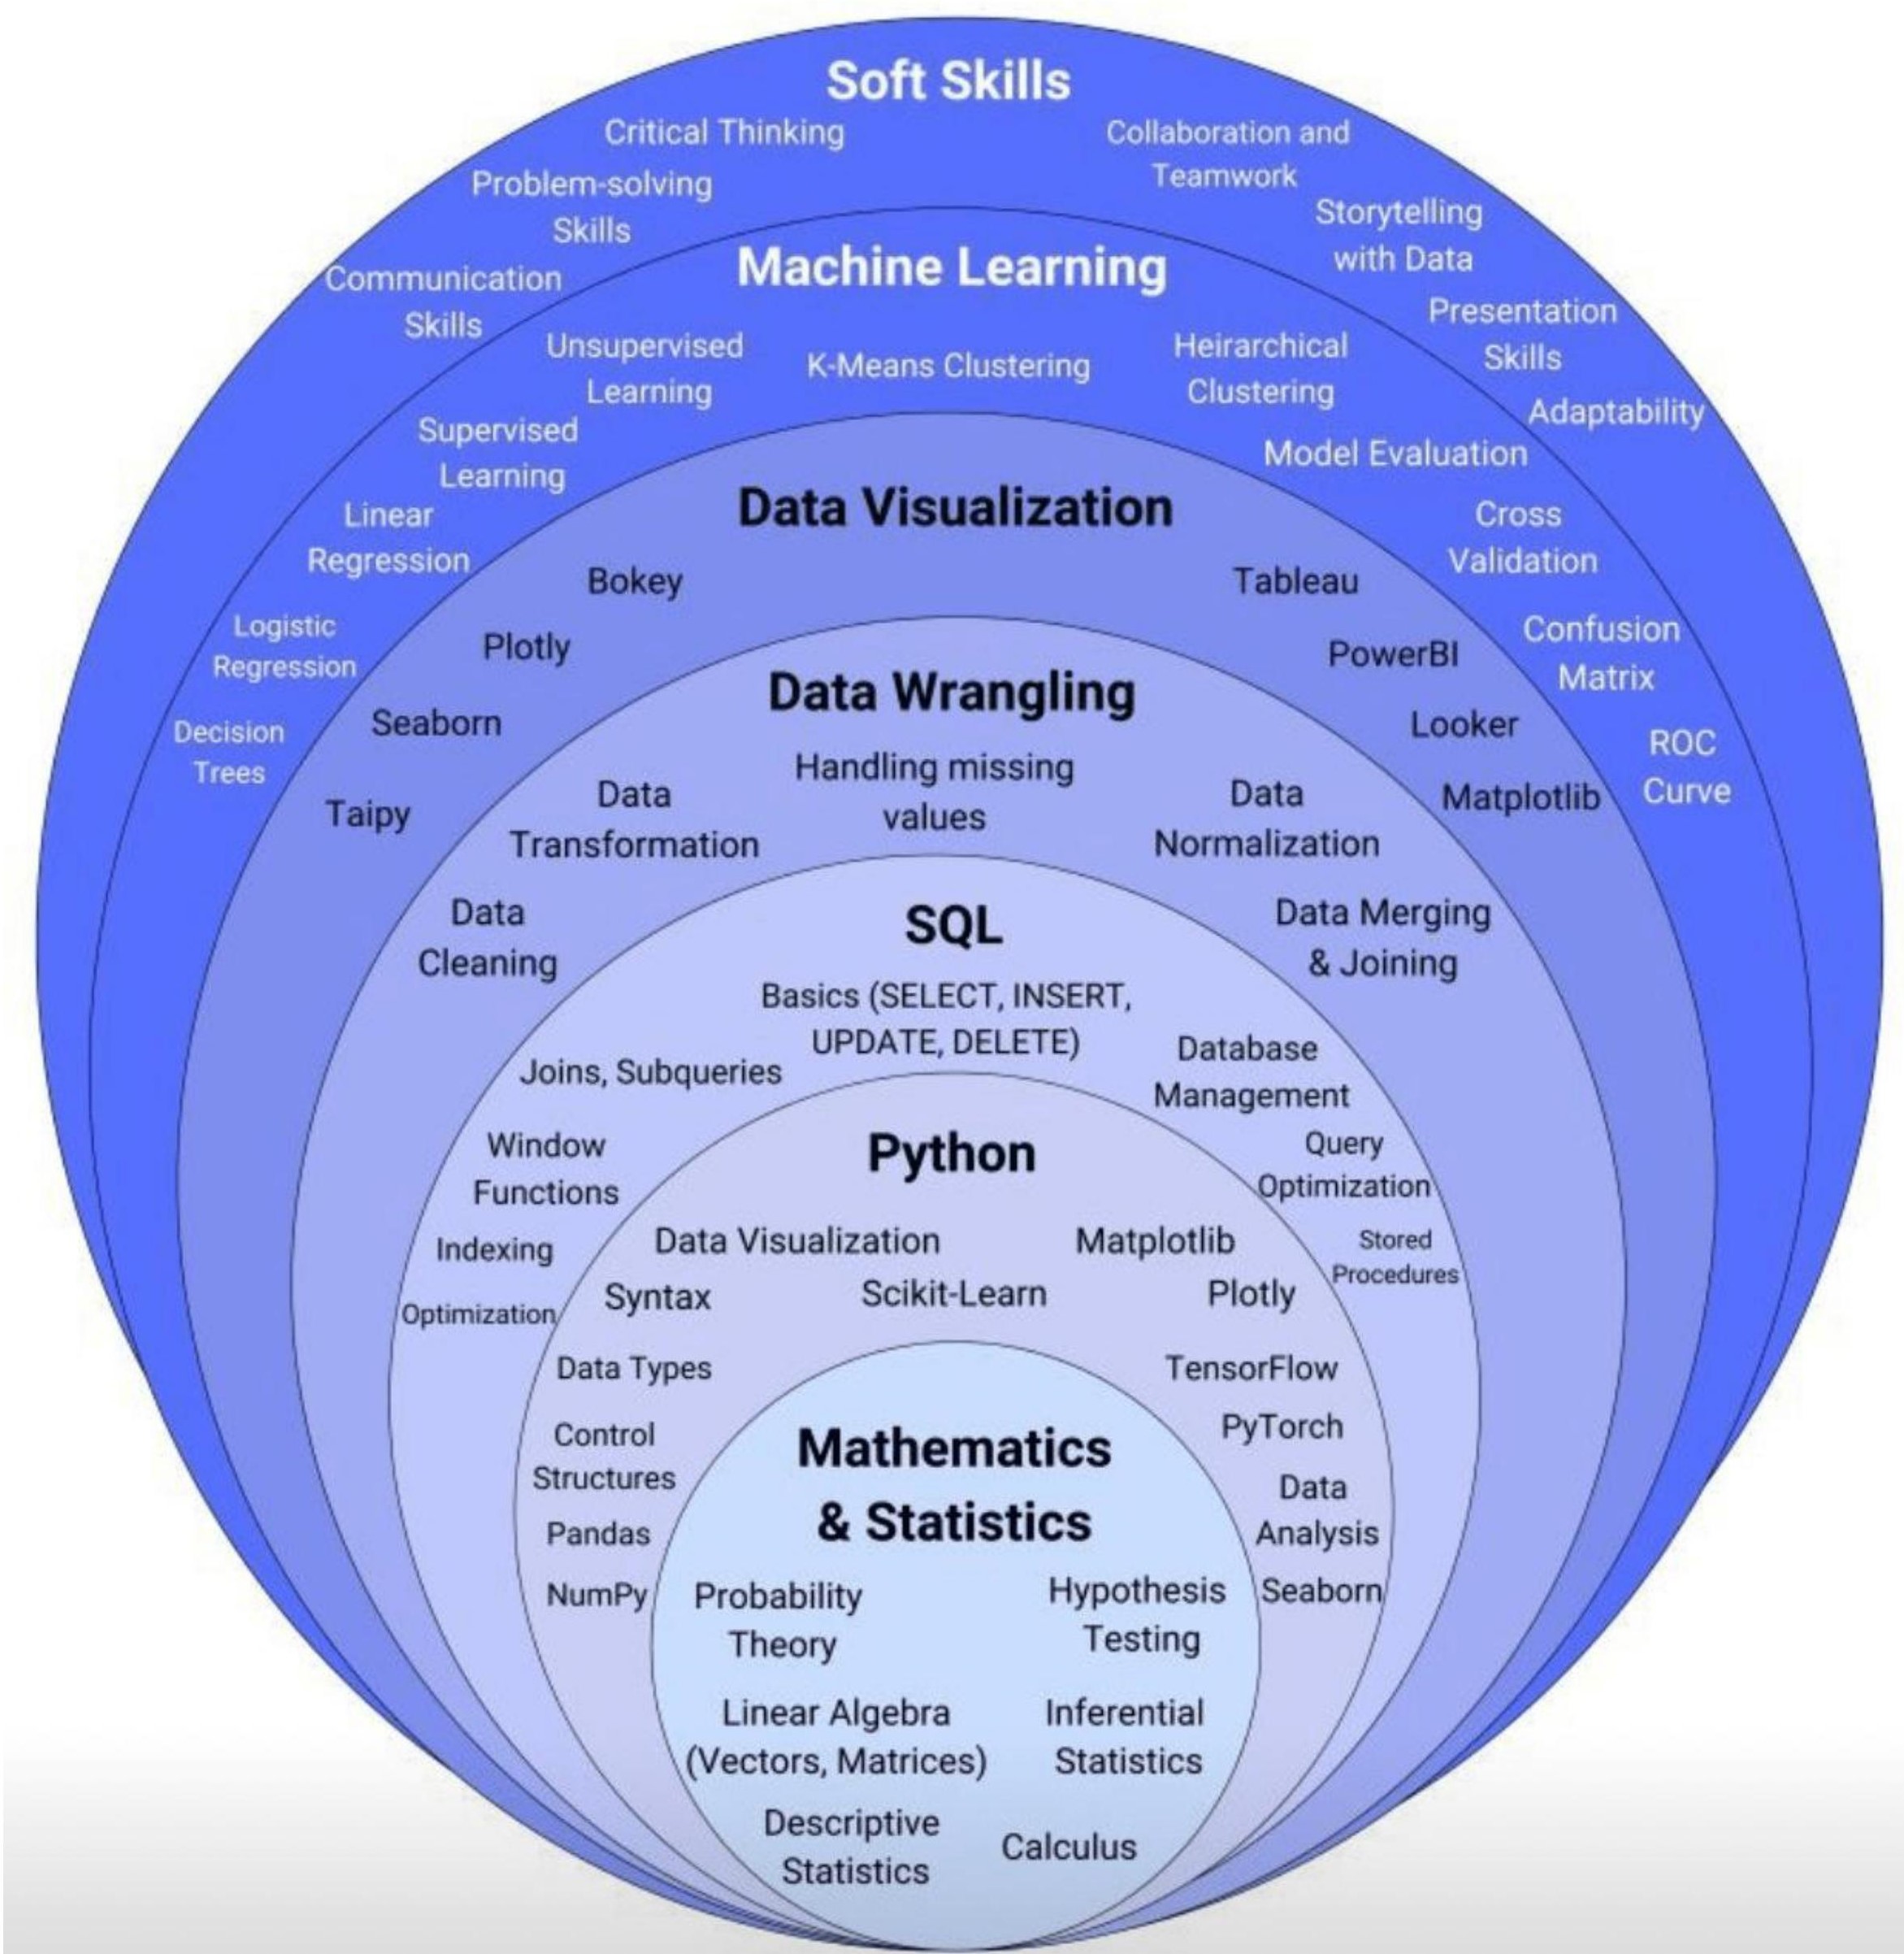
Proficiency in data analytics involves a combination of skills. For example, a solid understanding in mathematics and statistics helps one to gain the foundational knowledge in data science. Figure 1.7 depicts the skills necessary to be proficient in data science.
1.7 Roles in Data, Analytics, and AI
Different kinds of data professionals work in modern organizations. These roles include data analysts, business analysts, data scientists, machine learning engineers, and generative AI engineers. Figure 1.8 shows the skills these roles require and the tools professionals in those roles use. These roles share a common foundation in working with data, yet they differ significantly in focus, required skills, and typical deliverables, ranging from descriptive reporting and business decision support to building production‑grade machine learning and generative AI systems.
A data analyst is a professional who collects, cleans, and organizes data to produce insights that support business decisions. This role typically involves working with data from multiple sources, applying statistical and analytical techniques to identify trends and patterns, and translating those findings into clear reports, dashboards, and visualizations for nontechnical stakeholders. Data analysts often collaborate closely with business teams to clarify questions, define key performance indicators, and recommend data‑driven improvements to processes, products, or strategies, making them a central link between raw data and actionable decision‑making.
A data scientist is a specialist who uses advanced statistical modeling, machine learning, and programming to extract deeper patterns and predictive insights from large, complex datasets. Data scientists design experiments and build models, validate them using rigorous evaluation techniques, and then deploy or operationalize these models to support strategic decisions and automated systems. They typically work end‑to‑end across the data lifecycle—exploring data, engineering features, selecting algorithms, and interpreting results—while collaborating with business stakeholders and engineering teams to ensure that their solutions are both technically sound and aligned with organizational goals.
